
Summary :-
Market share analytics measures how much of a category’s sales your brand captures, broken down by retailer, product and competitor. Unlike basic sales reports, it shows how you perform against the whole market, so you know whether you’re truly winning or just riding category growth. The blog explains key metrics such as market share, share of shelf, competitor movement and private label pressure, and shows why national share can hide weak accounts and concentration risk. It lists five reasons brands need this view from spotting growth by account to building stronger cases for buyers. It then outlines how to get started with data from NielsenIQ and Circana, and ends with a short FAQ and a call to action.
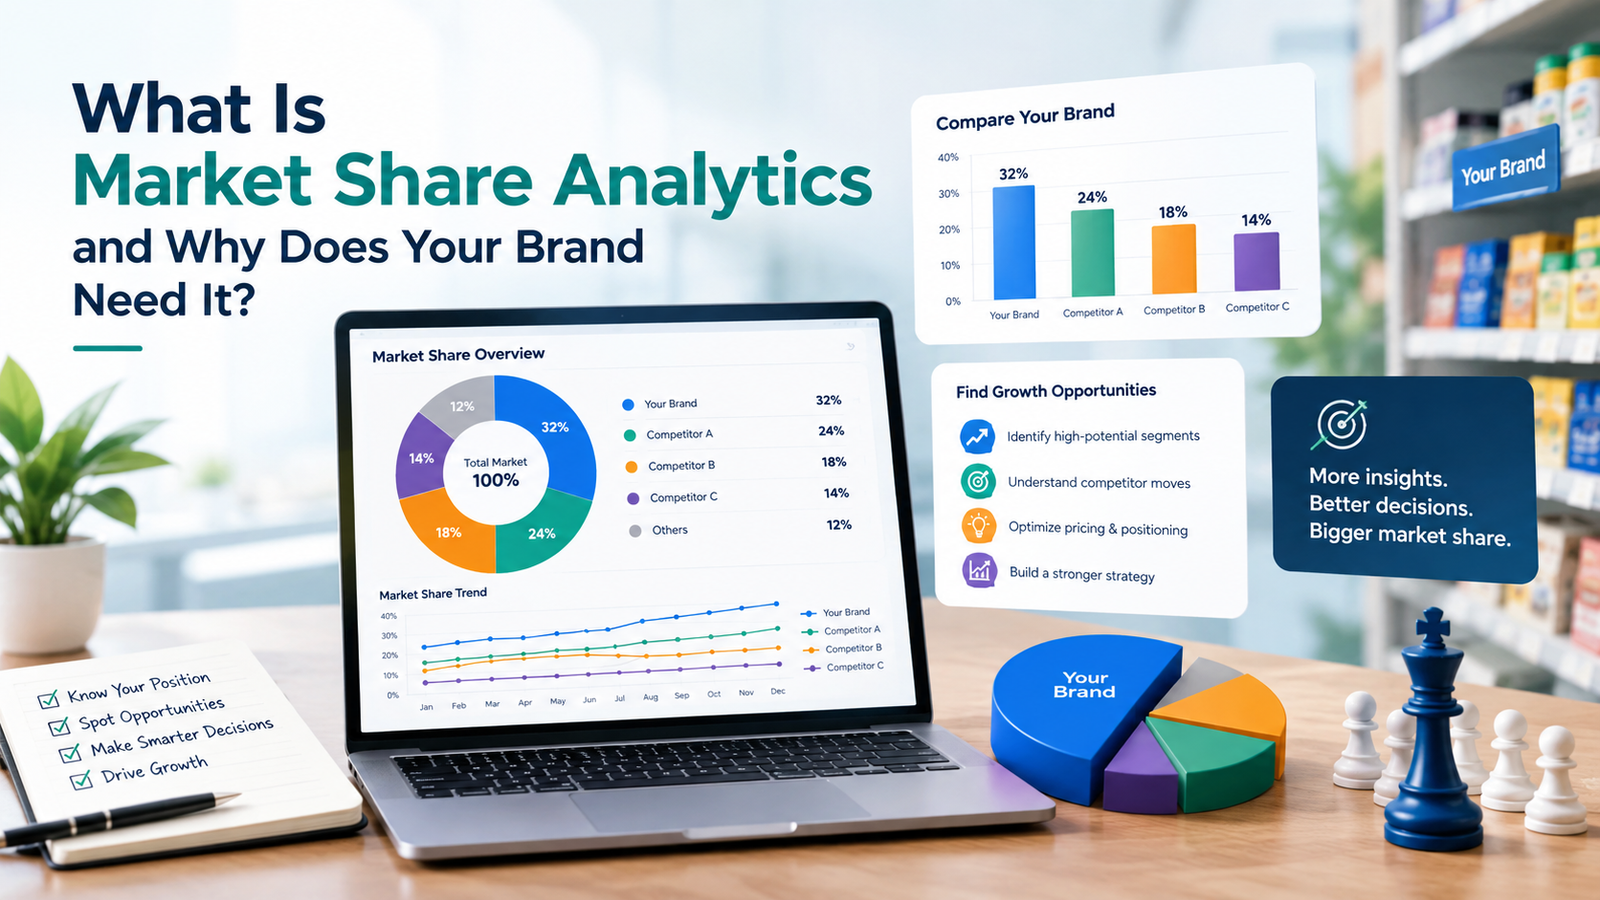
Sales are up this quarter but is your brand actually winning? Revenue alone cannot tell you, because it ignores what the rest of the category is doing. Market share analytics closes that gap by measuring your sales against the whole category, account by account. This guide explains what it is, which metrics it tracks and why brands that rely only on national numbers often miss the risks and opportunities hiding inside individual retailers.
What Is Market Share Analytics?
In simple terms, it shows what percentage of the market you own where you are gaining ground, and where rivals are taking it.Market share analytics is the practice of measuring your brand’s share of category sales and tracking how that share shifts by retailer, channel, product and competitor.
Basic sales reporting tells you what you sold. Market share analysis tells you how that compares with everyone else. A brand can grow 5 percent while its category grows 10 percent, which means it is quietly losing ground. Only a share view exposes that.
It also gives every team a shared scorecard. Sales can see which accounts to prioritize, marketing can see where campaigns lift share, and leadership can judge growth
against the real size of the opportunity rather than last year’s number.
Key Metrics Market Share Analytics Tracks
The right metrics turn raw sales data into a clear picture of where your brand stands. Some show your overall position, while others show how you perform at each retailer, in each category and against each competitor. Tracking them together helps you spot patterns early, compare accounts fairly, and decide where to focus your time, budget and shelf negotiations.
The core metric is market share and the market share formula is simple:
Market share (%) = brand sales ÷ total category sales × 100
This is how to calculate market share using either revenue or units. A mature market share analytics program goes further and tracks the following:
| Metric | What it tells you |
|---|---|
| Share by retailer or channel | Which accounts drive growth and which carry risk |
| Share by category and SKU | Which products win or lose within a category |
| Share of shelf | Your percentage of physical shelf space at a retailer |
| Competitor movement | Who is gaining or losing points, and where |
| Private label share | How store brands are affecting your category |
Share of shelf deserves close attention. High shelf space with low sales points to an execution problem while strong sales with little shelf space is a case for asking the buyer for more room. these views move the question from how much you sold to how much of the available opportunity you captured, and where you left points behind.
Why National Market Share Can Mislead You
A national figure averages your wins and losses into one number that is too broad to act on. Picture a brand with a healthy 15 percent national share. Behind it, the brand might hold 28 percent at one chain and only 3 percent at another (a hypothetical example). One buyer decision at the 28 percent chain could erase much of your volume, yet
the national number would give no warning. That is concentration risk, and it stays invisible when you only look at the headline number.
Retail market share analysis solves this. Buyers care about your share of their category in their stores, not your national average. Buyers also negotiate space, promotions and pricing account by account, so your evidence has to match that level. That is why market share analytics works best at the retailer level where you can catch a competitor gaining two or three points at one key account long before it reaches your national figure.
Why Your Brand Needs Market Share Analytics
1. Spot growth opportunities by account : Share by retailer shows which accounts have the most room to grow, so you can focus effort where one extra point of share is worth the most. A small gain at a large account often outweighs a big gain at a small one.
2. Catch competitor gains early : Competitor market share tracking lets you react while the gap is two points, not ten. Early warning gives you time to adjust pricing, promotions or distribution.
3. Diagnose shelf and sales gaps : Comparing sales share with share of shelf tells you whether the issue is execution or negotiation, so you fix the right problem. It also stops teams from chasing sales fixes when the real issue is space.
4. Track private label pressure : Store brands are gaining ground at many retailers, but the threat varies by category and account. Retailer-level data shows where they are encroaching and where you still lead. That helps you plan assortment and pricing before store brands take hold.
5. Build a stronger case for buyers : Line reviews go better when you arrive with account-level evidence instead of national averages, because buyers can see how you perform in their stores. It turns the conversation from opinion into evidence.
How to Get Started with Market Share Analytics
1. Define your category and competitors : Decide which products and rivals make up your market, and keep that definition consistent over time.
2. Choose your data sources : CPG market share data usually comes from syndicated providers such as NielsenIQ and Circana, which you can combine with retailer portals and your own sales data.
3. Segment by account, category and SKU : Break the data down far enough to see where share is won or lost, and by whom.
4. Set a review rhythm : Check trends monthly, and sooner during promotions, price changes or line reviews.
5. Turn findings into decisions : Name the account to defend first and the account to grow next.
Building this in-house takes specialist skills and time. Many brands choose a partner that already has the framework so they get buyer-ready answers in days instead of quarters. Whichever route you take, start small with your top three accounts and expand once the reporting rhythm is working.
FAQ’S :-
What is market share analytics in simple terms?
It measures how much of a category’s sales your brand captures, broken down by retailer, product and competitor. That way you can see exactly where you are winning, where you are losing, and which accounts or competitors deserve your attention first.
How do you calculate market share?
Divide your brand sales by total category sales and multiply by 100. For example, $2 million in sales in a $20 million category is a 10 percent share. Use revenue or units, and keep the time period and category definition the same for every comparison.
What is the difference between market share and share of shelf?
Market share is your percentage of category sales. Share of shelf is your percentage of physical shelf space at a retailer. Comparing both reveals execution gaps and negotiation opportunities.
Why does retailer-level share matter more than national share?
National averages hide account-level wins and losses. Buyers judge you by your share in their own stores, so that is where purchasing and shelf decisions are made. Knowing your numbers at each retailer helps you defend weak accounts, grow strong ones, and negotiate with real evidence.