
Summary:
Retail pricing analytics shows brands how price changes affect volume, margin, and profit. This blog covers elasticity, promo lift, competitor price gaps, and hidden margin leaks, along with a simple five-step workflow to get started. It also compares building an in-house team with working with an analytics partner.
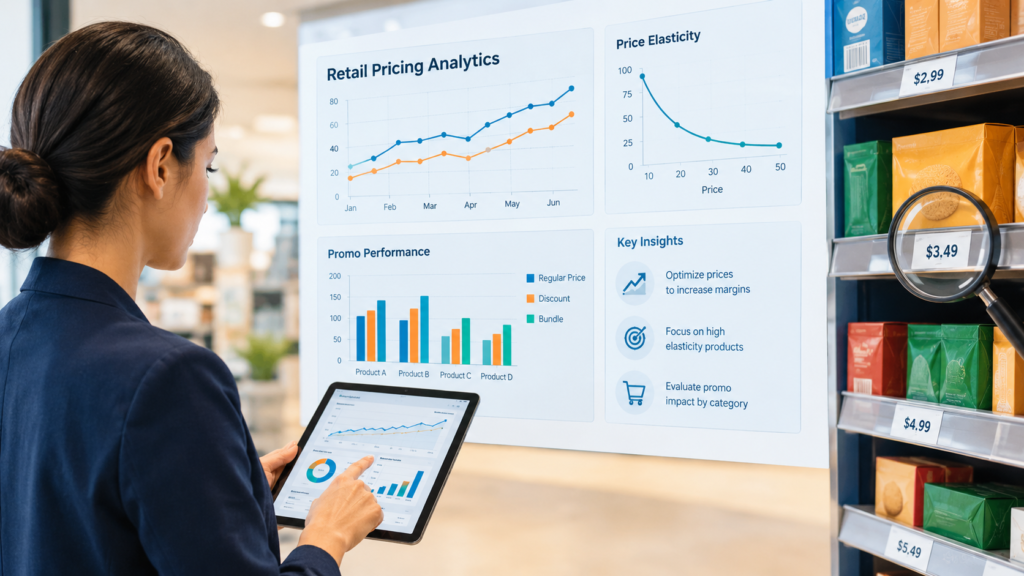
A brand runs a 20% promotion at a major retailer. Units jump and the sales team celebrates. Then finance points out that margin fell, and part of the lift was demand pulled forward from full-price weeks. Without pricing analytics, nobody can say what the promotion actually earned.
That is the gap pricing analytics fills. Many brands still set prices using cost-plus rules, last year’s promo calendar, or whatever the retailer asks for. That works until someone asks what a price change did to volume and profit, and nobody has an answer.
What Is Retail Pricing Analytics?
Retail pricing analytics uses sales, competitor, and promotional data to show how price affects volume, revenue, and margin by product, retailer, and channel. Brands use it to decide where to hold price, where to adjust it, and which promotions deserve funding.
It replaces two guesses: what shoppers will pay and what competitors will do. Related terms often get blurred, so here is how they differ. Pricing analytics in retail explains
what happened and why. Pricing intelligence is the ongoing monitoring layer. Dynamic pricing is when prices adjust automatically, and dynamic pricing analytics goes a step further by using demand and competitor data to guide those changes. Dynamic pricing is one tactic, not the whole discipline.
Brands also face a different version of this problem than retailers do. Retailers control the shelf price. Brands influence it through list price, minimum advertised price (MAP) policies, promo funding, and key account negotiations. So brand-side analytics leans on POS data, sell-through, and retailer price gaps.
The Four Questions Pricing Analytics Answers
Four questions drive most pricing decisions. Each needs different data, and each can quietly cost margin when nobody answers it.
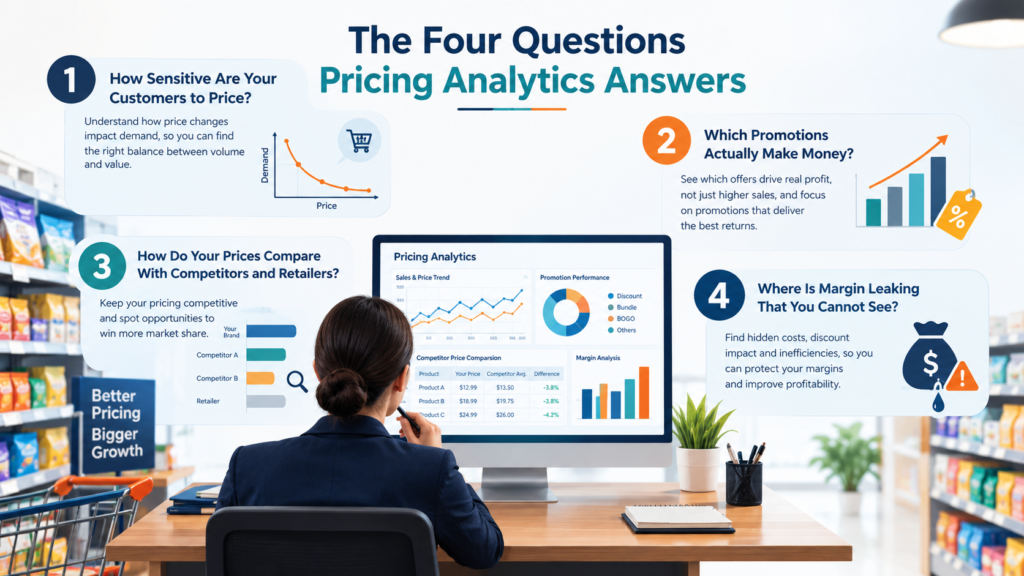
How Sensitive Are Your Customers to Price?
Short answer: it depends on the product. Price elasticity analysis shows how much each product’s sales respond to a price change. Elasticity is the percentage change in units sold divided by the percentage change in price. High-elasticity items swing hard when price moves. Low-elasticity items barely react.
Consider a hypothetical example. A product sells 100 units at $100 with a $60 cost, so profit is $4,000. Cut the price 10% and units rise 25%. Revenue climbs 12.5%, which looks like a win, but profit drops to $3,750 because each unit now earns $30 instead of $40.
Elasticity also varies by SKU, retailer, and channel, so treat it as a set of curves, not one number. A rough guide:
● High elasticity: test smaller promo depths or bundles before cutting price.
● Low elasticity: test a modest increase and watch unit response.
● Unclear: run a controlled test before changing anything.
Which Promotions Actually Make Money?
Promotion analysis, also called promo effectiveness measurement, separates real lift from pulled-forward demand. A promotion pays off only when incremental profit exceeds the cost of the discount and trade spend. Promo lift is the extra volume the event creates compared with what you would have sold anyway.
That extra volume is rarely all new. Analysts split it into incremental units, cannibalization of your other SKUs, halo effects on related items, and forward buying, where shoppers stock up and then buy less afterward. Track promo ROI, the post-promo dip, and trade spend per incremental unit.
Picture, hypothetically, the same item at 15% off and at 25% off. The deeper event sells more units, yet the shallower one earns more contribution margin because fewer of its sales would have happened anyway. Without this kind of price elasticity analysis, the bigger discount looks like the winner. InsightsBySolaris builds this kind of measurement into its promo planning work, so calendars reflect results rather than habit.
How Do Your Prices Compare With Competitors and Retailers?
Competitive price monitoring compares your prices with competing brands across retailers and marketplaces. It surfaces problems early: MAP violations, a marketplace seller undercutting your best-seller, or a rival dropping price ahead of a holiday event.
In consumer electronics, for example, a competitor might cut the price of a top model. A weekly gap report catches it within days, not at the next quarterly review.
A gap is not automatically a problem, though. Check it against unit trends and market share before reacting, or you may start a price war you did not need.
Where Is Margin Leaking That You Cannot See?
Margin leaks through underpriced items, promotions that lift volume but not profit, and accounts where net price has drifted below plan. Top-line sales reports rarely
show any of it.
Start with key value items (KVIs), the few products shoppers use to judge whether pricing is fair. Protect their position, then look for room elsewhere. A weekly rhythm helps: review exceptions such as margin drops, KVI gaps, and weak promos, pick a few actions, and measure what changed.
A Simple Pricing Analytics Workflow
You do not need a full model to begin. A practical sequence:
1. Pull 12 to 24 months of POS and shipment data by SKU and retailer.
2. Add your promo calendar and competitor prices.
3. Estimate elasticity and promo lift for your top SKUs first.
4. Run scenarios for price changes, promo depth, and timing.
5. Change one thing, measure it, and feed the result into the next decision.
Start with the 10 to 20 SKUs that drive most of your revenue. Watch for data problems that distort results, such as missing promo flags, SKU codes that differ across
retailers, and stockouts that make demand look weaker than it was.
Common Mistakes That Undermine Pricing Decisions
Most pricing errors are process errors:
● Treating one elasticity figure as true for every product and retailer.
● Judging promotions on revenue instead of contribution margin.
● Reacting to every competitor move.
● Changing prices so often that shoppers stop trusting them.
● Ignoring stockouts when reading demand data.
● Running analysis with no owner or decision date, so reports never change a price.
Build In-House or Work With an Analytics Partner?
Build in-house if you have a large SKU count, daily pricing decisions, and data engineers already on staff. Choose a partner if your team is lean and you need reliable reporting soon.
| In-house team | Analytics partner | |
|---|---|---|
| Start-up | Slower, needs hiring and training | Faster to begin |
| Cost | Fixed salaries and tools | Scales with scope |
| Retail account know how | Built over time | Available from the start |
| Best for | Large, ongoing pricing operations | Lean teams needing quick answers |
InsightsBySolaris was analysts and runs a plug-and-play model. Brands get pricing analytics, sales analytics, and forecasting without the overhead of hiring, training, and managing a team.
FAQs :-
What is pricing analytics in retail?
It is the use of sales, price, promo, and competitor data to understand how price changes affect volume and profit, so brands and retailers can set prices with evidence.
How does pricing analytics improve profit?
It shows which price and promo changes raise contribution margin, not just sales. Brands can then cut unprofitable discounts and raise prices where shoppers are less sensitive.
What data do you need for retail pricing analysis?
Sales or POS data, price history, promo calendars, product costs, and competitor prices. Twelve to 24 months of history by SKU and retailer gives a solid starting point.
How do you measure price elasticity?
Divide the percentage change in units by the percentage change in price. Compare periods or retailers with different prices, and control for promotions and stockouts.
What is the difference between pricing analytics and dynamic pricing?
Pricing analytics explains how demand responds to price and helps teams make better decisions. Dynamic pricing automates some of those decisions. Dynamic pricing analytics supplies the data behind them, tracking demand, inventory, and competitor prices so prices adjust when conditions change.
Can smaller brands use pricing analytics without a data science team?
Yes. Start with your top SKUs and a weekly review of margin, promo results, and price gaps. An analytics partner can fill any modeling gaps.